Environmental Initiatives
- Sustainability Initiatives and Policy
- Environmental Initiatives
- Social Contribution Initiatives
- Corporate Governance
- Green Financing
- Sustainability-related Disclosure
- Climate Change Initiatives
- Environmental Targets and performance data
- Initiatives to Reduce Environmental Impact
- Utilize Environmental Certification Programs
Climate Change Initiatives
Recognition Regarding Climate Change
Recognizing that climate change is an important challenge that dramatically changes the natural environment and social structure and has a significant impact on all business activities, IRM expressed its support for the recommendations made by the Task Force on Climate-Related Financial Information Disclosures (TCFD) in March 2020. Based on these TCFD recommendations, ADL conducts climate change-related analyses and disclosures under the framework of governance, strategy, risk management, and metrics and targets, to appropriately assess climate change-related risks and opportunities and reflect them in their management and operation policies with the aim of ensuring sustainable and stable income over the long term.
![]()
Governance
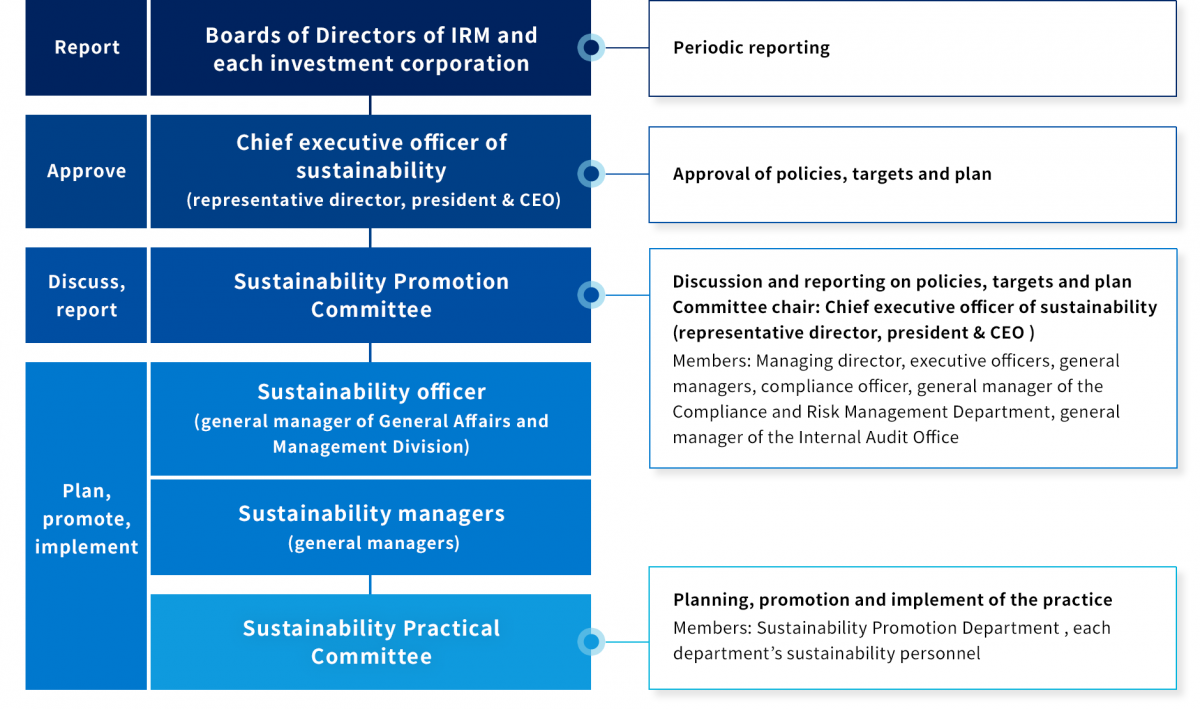
Management’s roles and oversight by the Boards of Directors of IRM and each investment corporation
- IRM has established the Sustainability Promotion Committee, which is chaired by the representative director, and the Sustainability Practical Committee, which is composed of employees responsible for actual operations in each department.
- The Sustainability Promotion Committee meets at least twice a year to implement a PDCA cycle with the aim of improving asset value over the medium to long term. The PDCA cycle consists of the following steps: formulate sustainability goals and initiatives, identify and evaluate climate-related risks and opportunities, analyze climate-related risks and manage them company-wide, monitor environmental performance as well as the results of ESG evaluation by external organizations, verify the degree of achievement of goals, and reset goals for remaining and new challenges.
- Sustainability goals are set by the representative director, who is the chief executive officer of sustainability, and the progress made toward goals and on initiatives is reported to the Board of Directors of IRM and each investment corporation at least once a year. The Sustainability Practical Committee is responsible for promoting various measures needed to achieve these goals.
Risk Management
Management Process (risk identification and evaluation and integration with company-wide risk management)
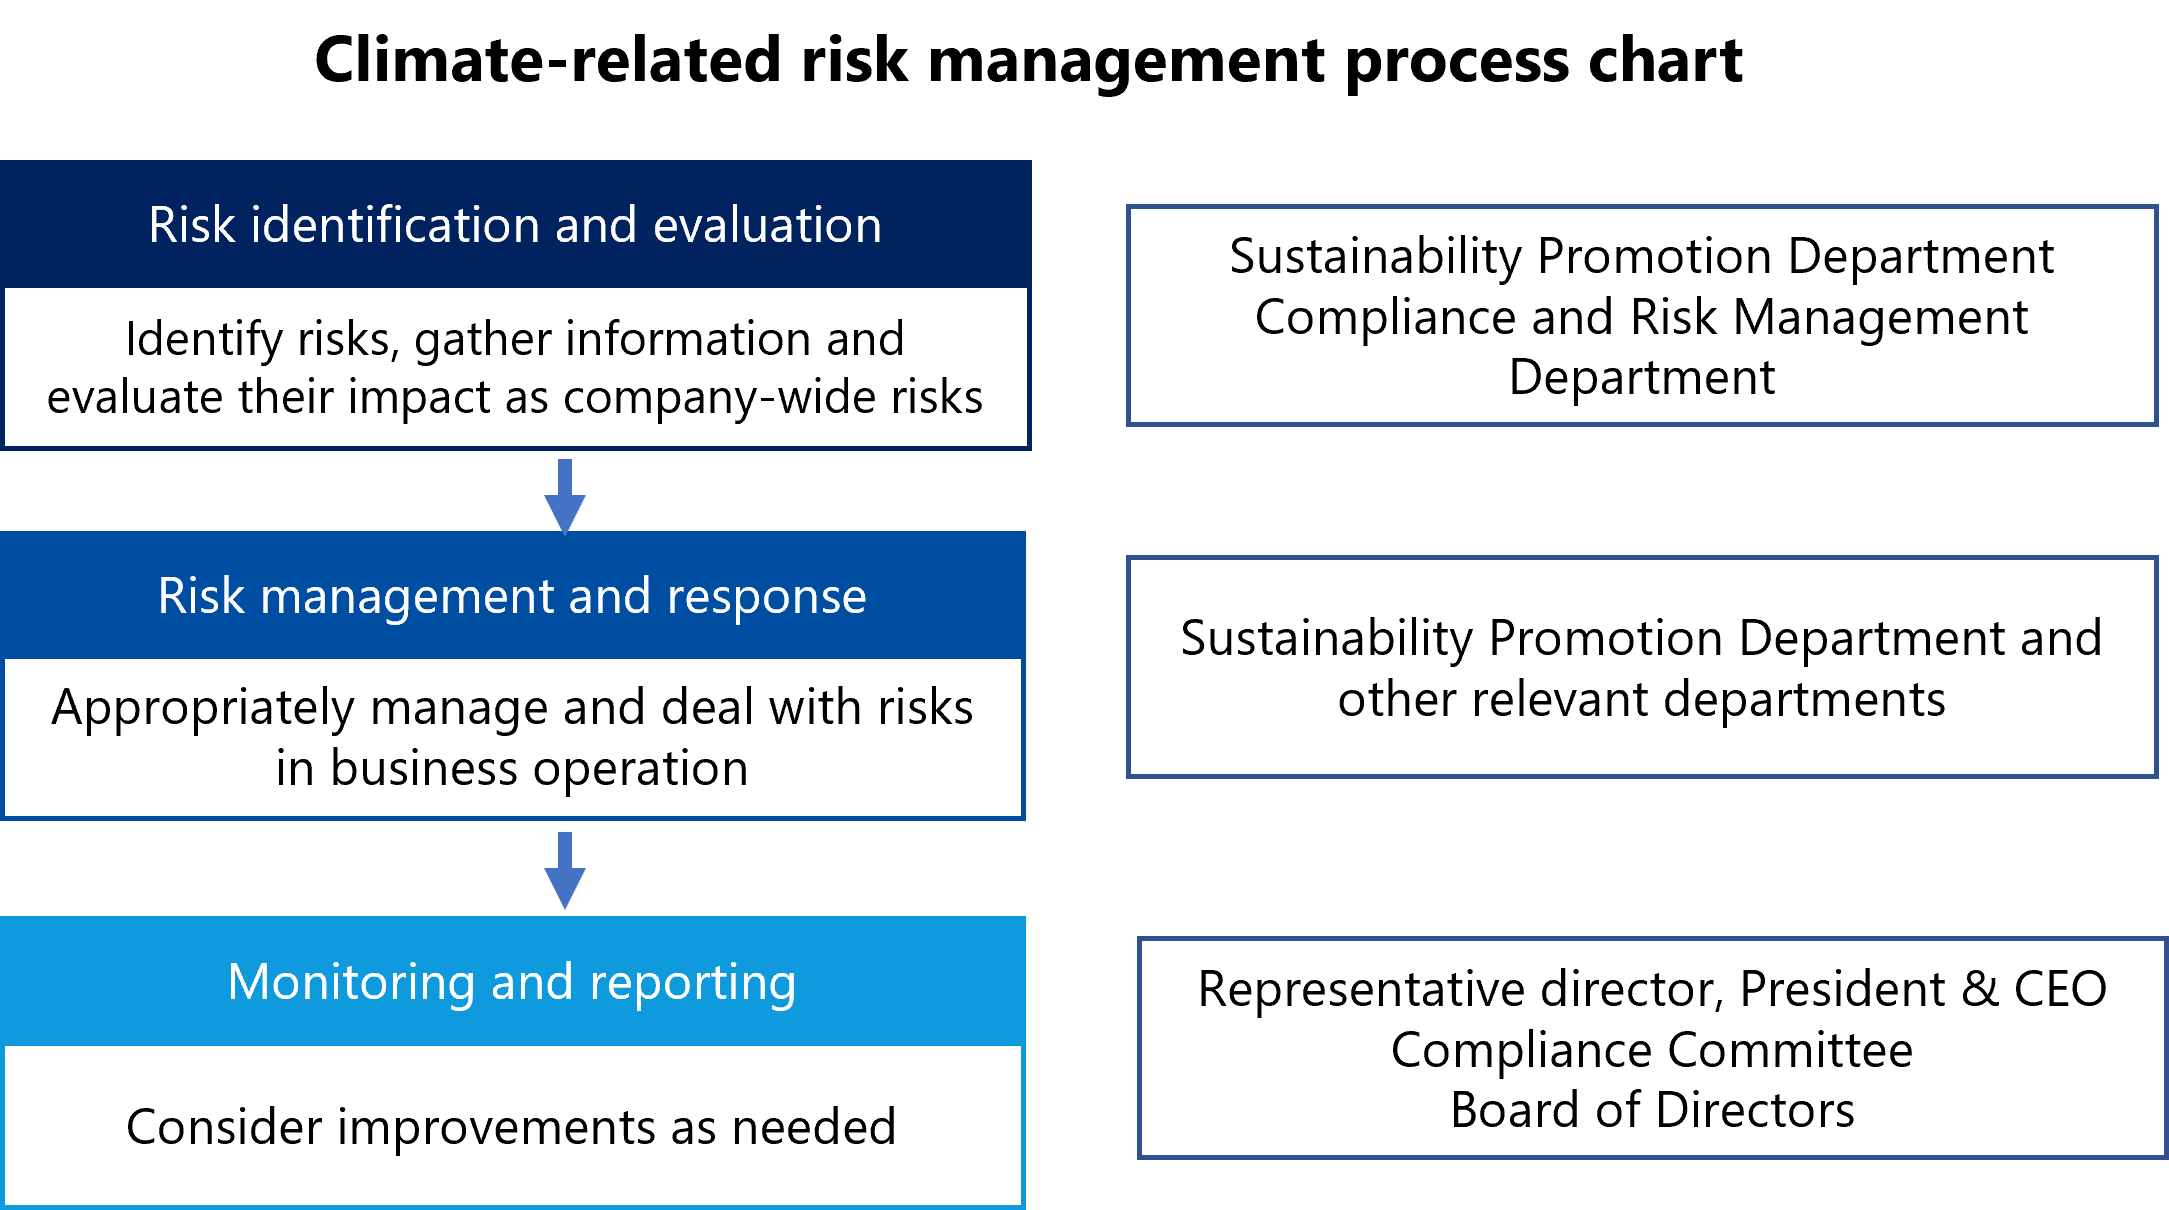
- IRM has established the Risk Management Rules and Risk Management Standards as its internal rules to comprehend various risks and opportunities including those related to climate change, to clearly set out our basic approach and internal management structure for such risks and opportunities, and to help ensure the appropriate operation of our business and the soundness of our business management.
- While positioning climate-related risks as having a material impact on the financial and strategical aspects of our business, IRM also sees climate-related risks as opportunities and manages them as part of the company-wide risk management process whereby the Compliance and Risk Management Department gathers information on risks including climate-related risks from other departments, evaluates the degree of their impact, and then identifies company-wide risks following discussions by the management team.
- The Compliance and Risk Management Department reports to the representative director, who is the Chief Executive Officer of IRM, the monitoring status of company-wide risks and opportunities twice a year as well as making reports to IRM’s Compliance Committee and Board of Directors as needed.
Strategy
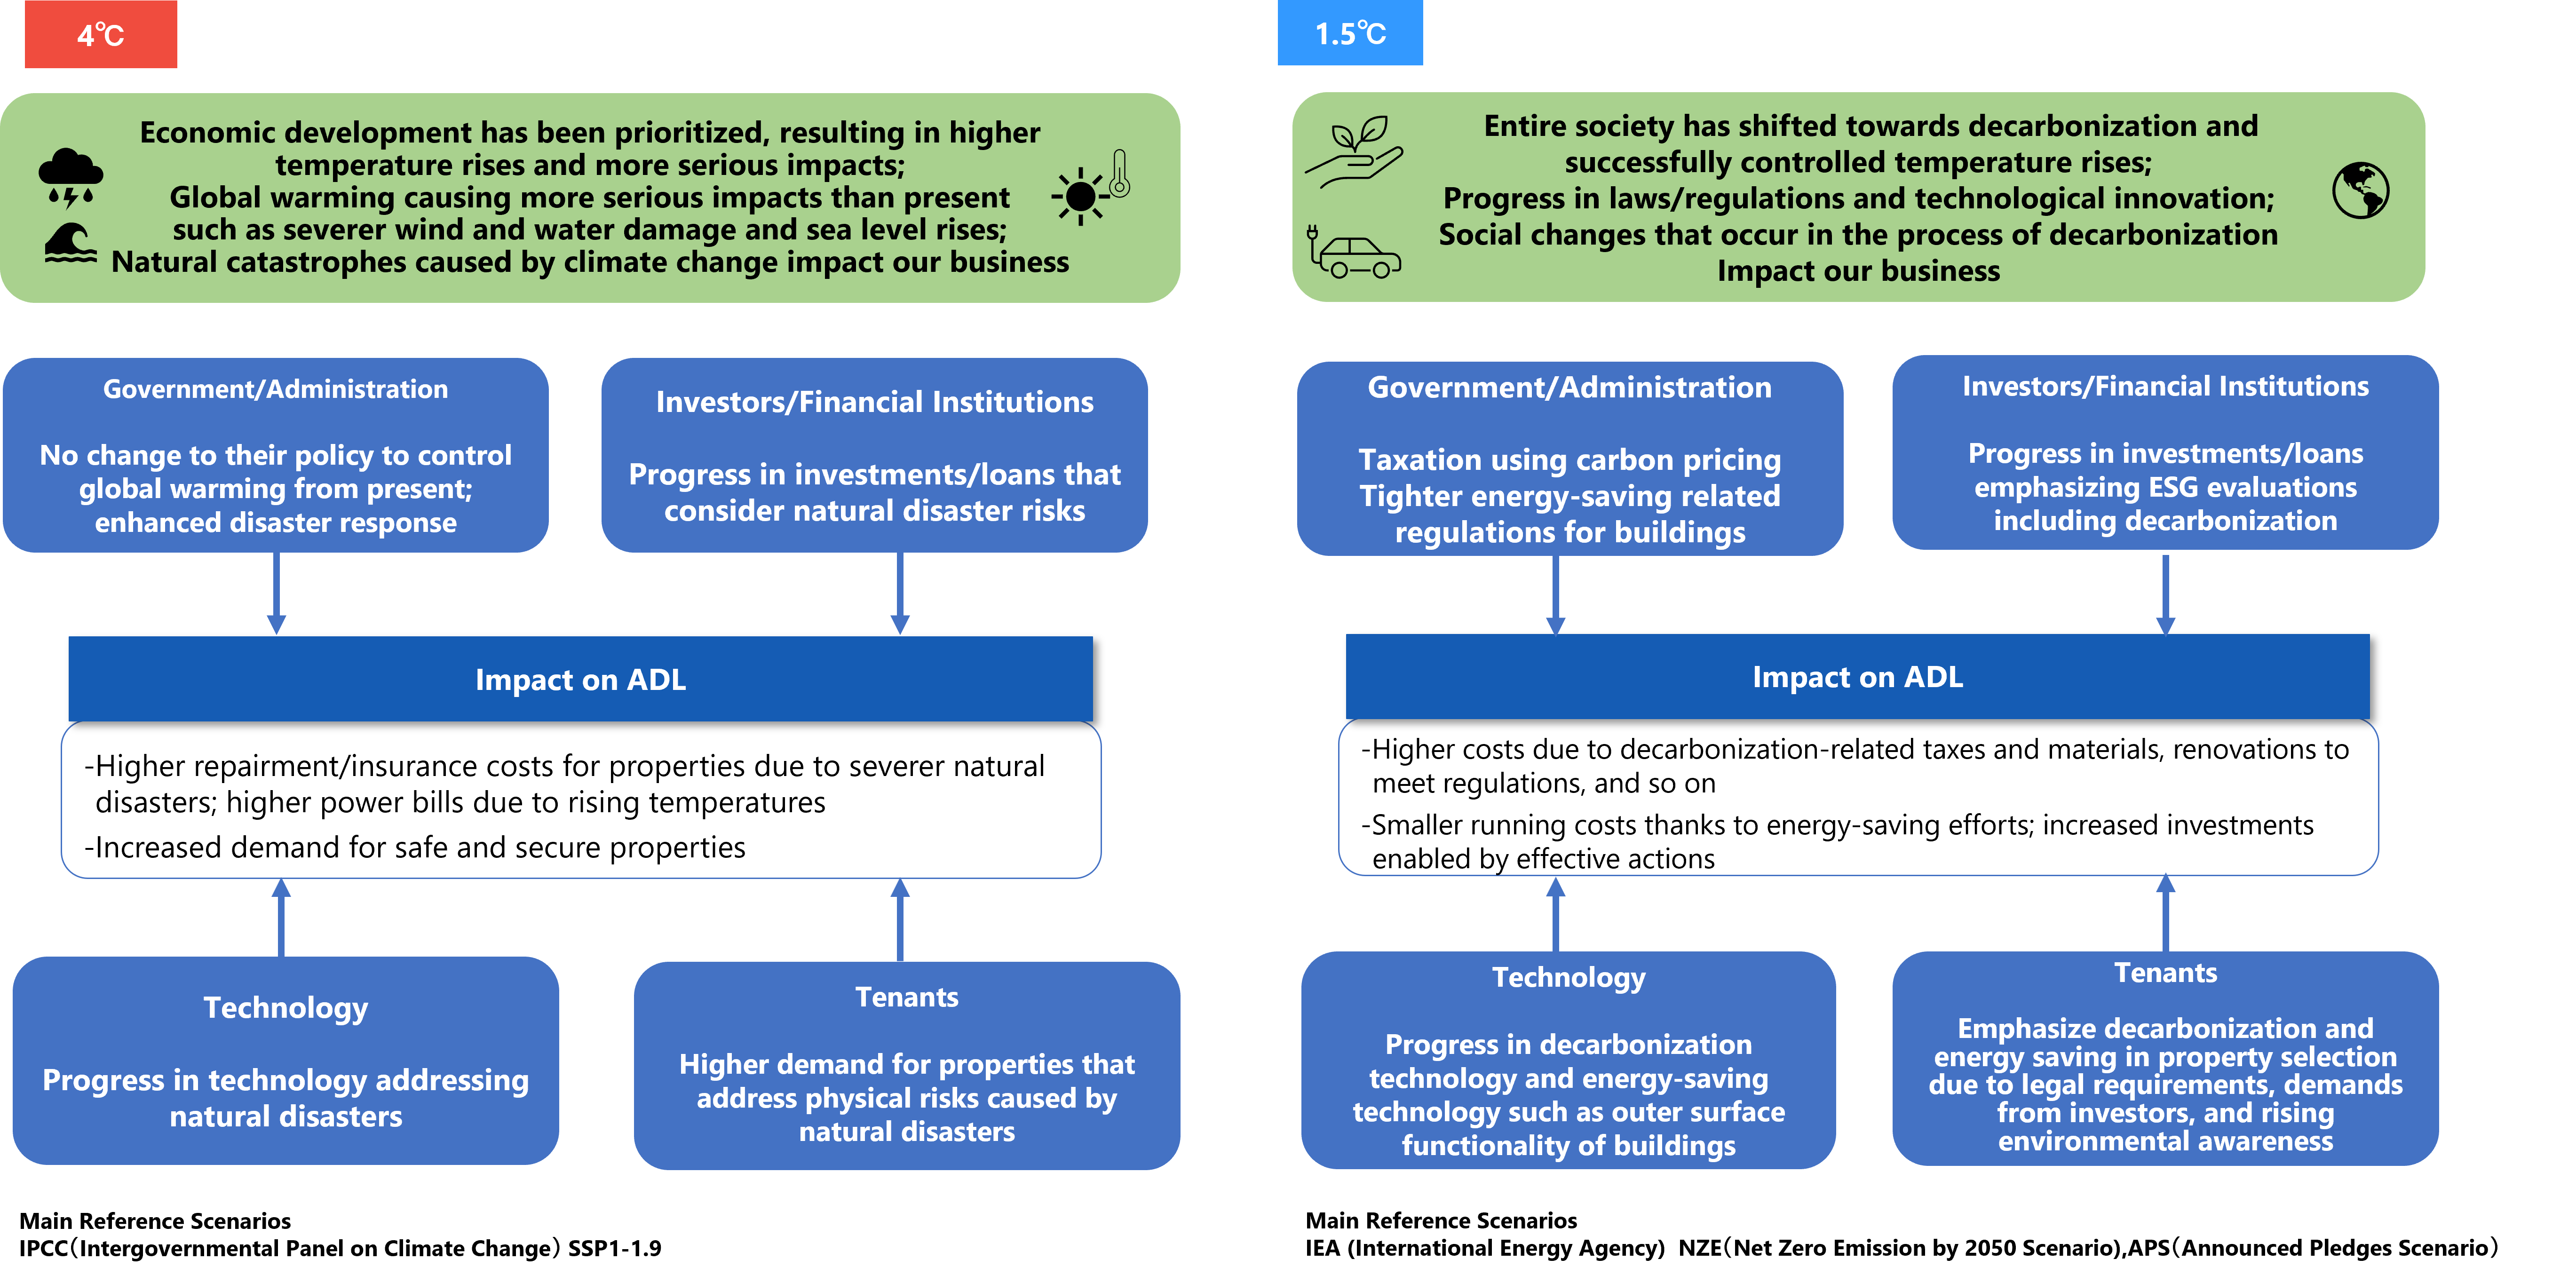
We classify various change factors in the external environment resulting from climate change into transition risks and physical risks and identify and evaluate them as risks and opportunities. We select any factors that have a material impact on our business and run scenario analysis. We mainly analyze and calculate transition risks related to “policies/regulations, markets, reputation,” and physical risks in the categories of “acute/chronical,” and opportunities related to “markets, energy sources, resource efficiency, products and services.” We aim to reduce our environmental impact while achieving a medium- and long-term growth by addressing climate change-related risks and enhancing our efforts to capture opportunities.
Scenario Analysis
The following chart shows the images of the world surrounding our investment corporations in the climate change scenarios with a 4-degree Celsius temperature rise and 1.5-degree Celsius temperature rise as the background for risk and opportunity identification and evaluation.
Risk and opportunity identification and impact analysis
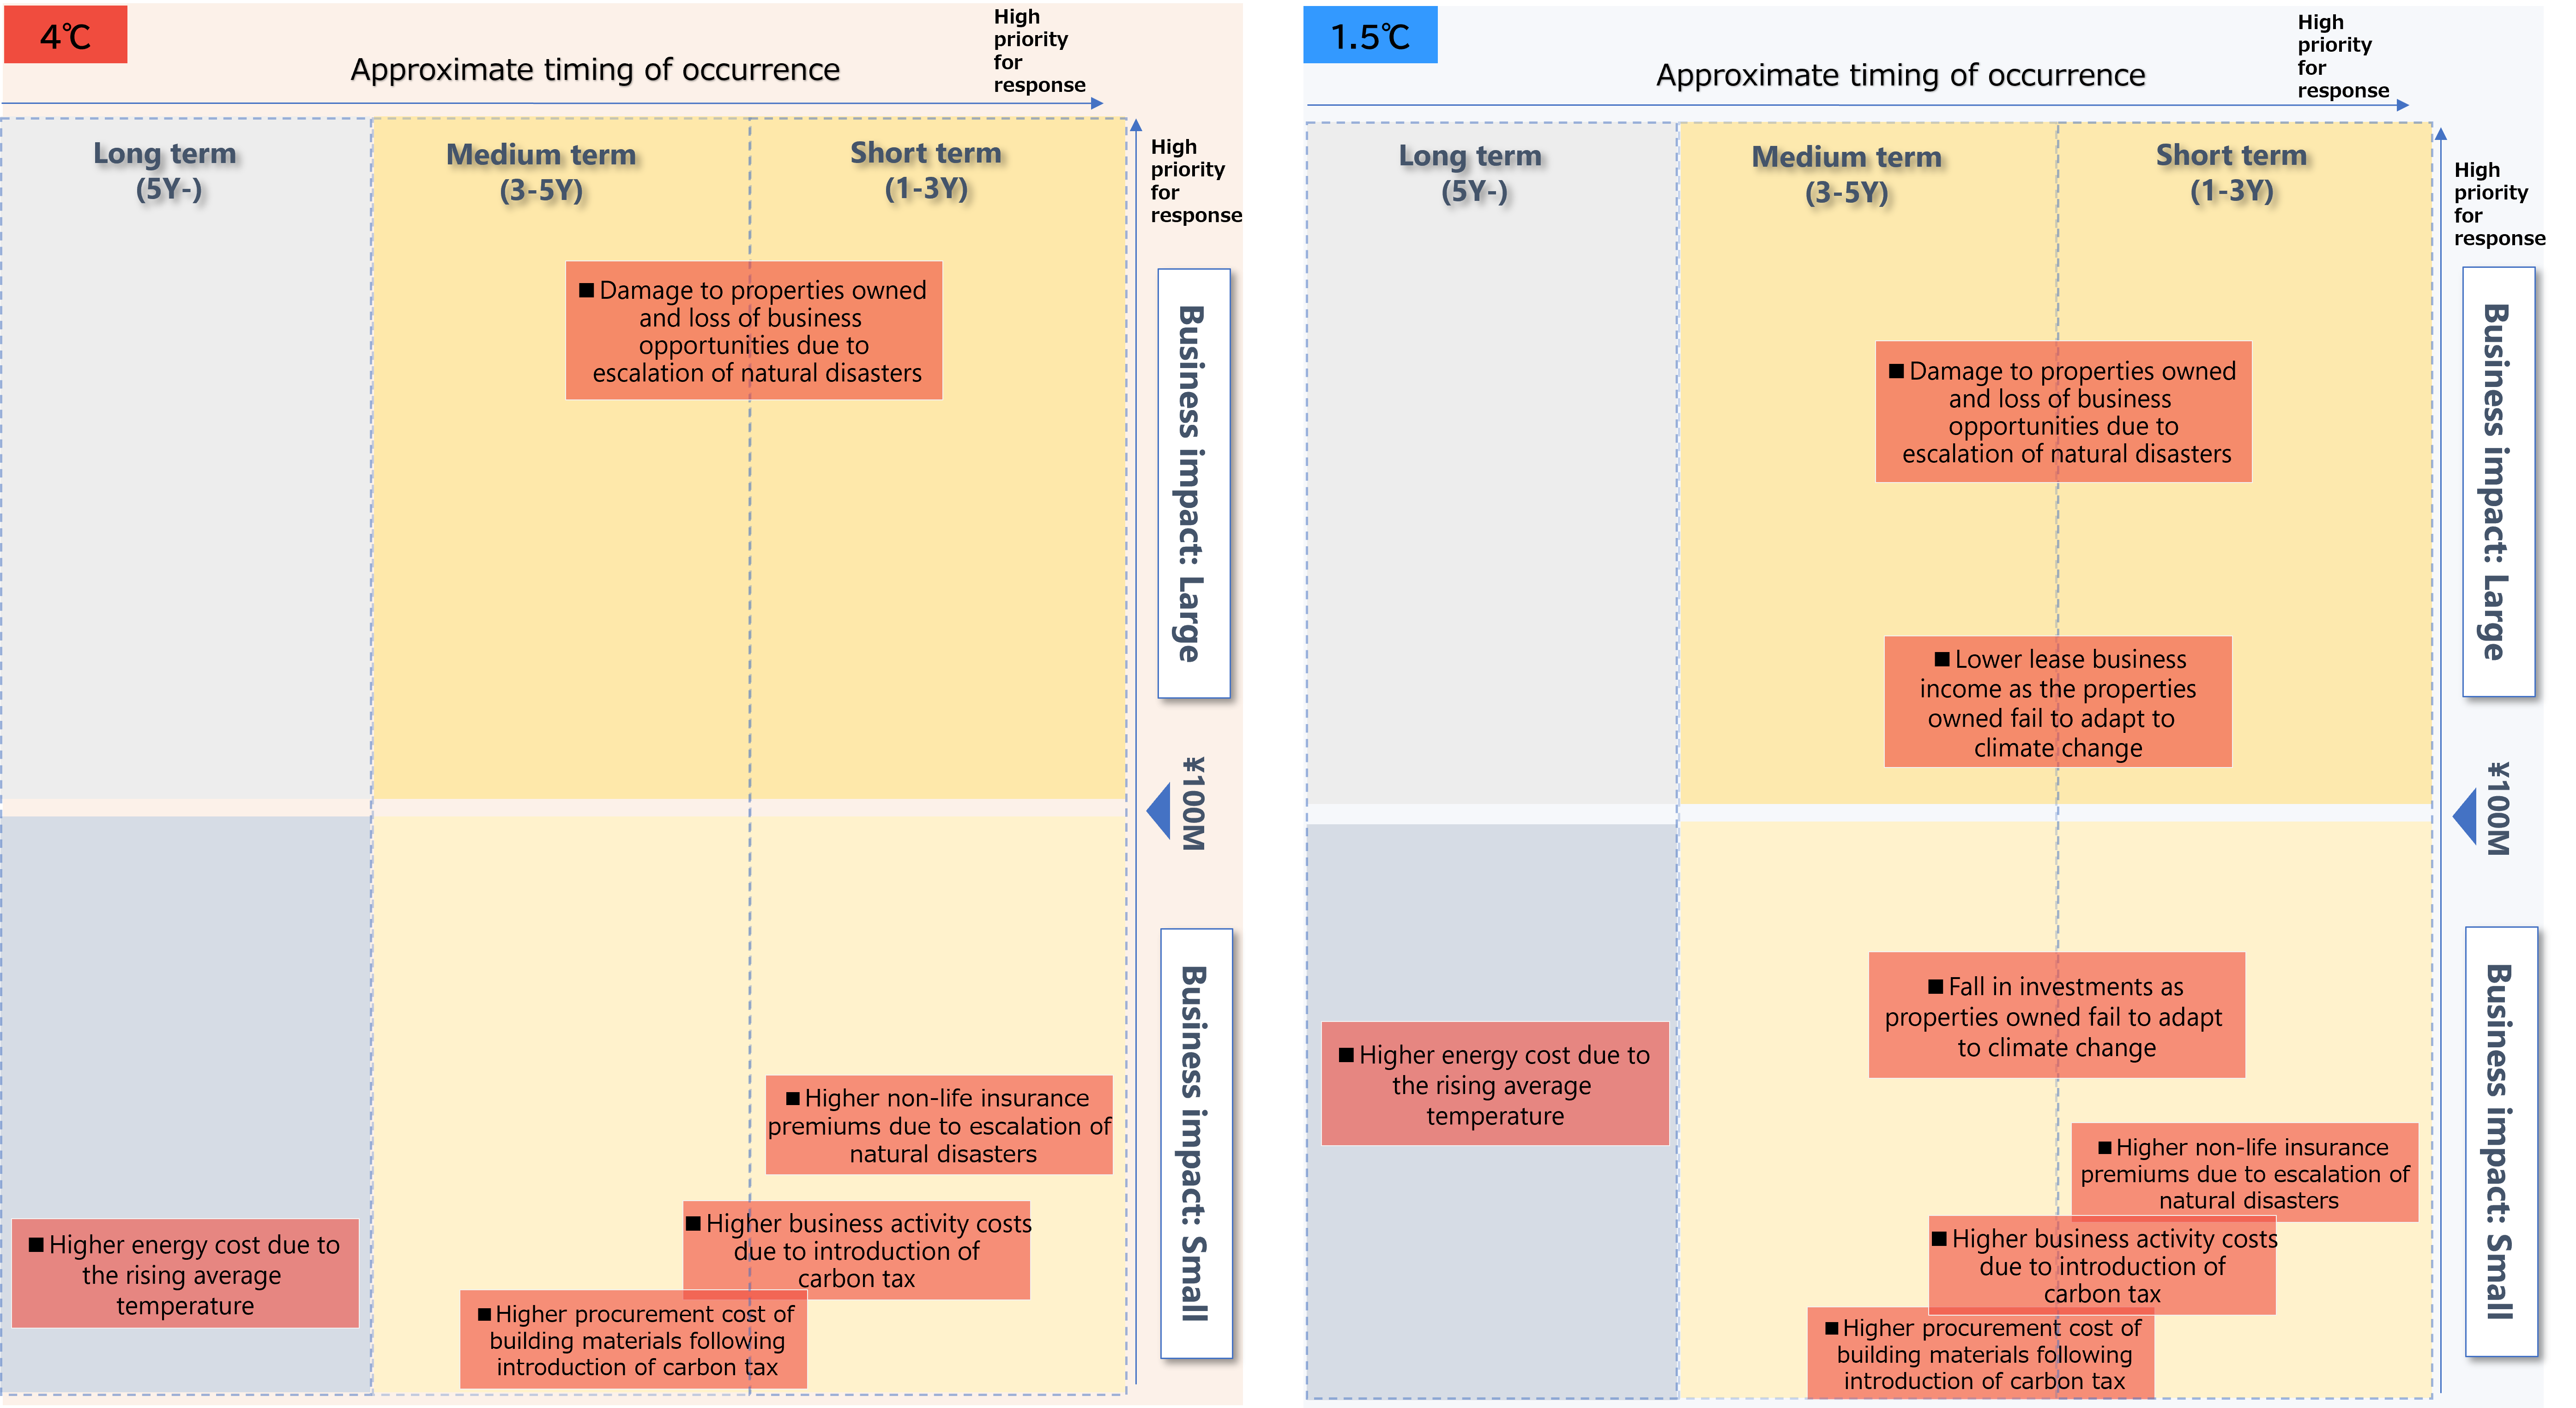
In order to identify the climate-related risks assumed in scenarios with a 4-degree Celsius temperature rise and 1.5-degree Celsius temperature rise, as well as to understand the priority level of response, ADL has examined the "timing of onset of each risk" and presented it in the following diagram. The "Business Impact" is based on the financial impact of each risk.
The "Approximate timing of occurrence" indicates the time when each risk is assumed to have a high likelihood of occurrence, as of FY2023, when the analysis was conducted. The timing of occurrence is based on a qualitative consideration of the world view of each scenario based on the advice of a third-party organization, and does not guarantee the accuracy of the timing of occurrence.
- The "Approximate timing of occurrence" indicates the time when each risk is assumed to have a high likelihood of occurrence, as of FY2023, when the analysis was conducted. The timing of occurrence is based on a qualitative consideration of the world view of each scenario based on the advice of a third-party organization, and does not guarantee the accuracy of the timing of occurrence.
Identified risks/opportunities, Countermeasures
The following shows potential climate change-related risks for ADL in the images of the world in the 1.5-degree Celsius and 4-degree Celsius scenarios, their financial impacts, countermeasures, and possible opportunities for ADL's business.
| Category | Factor | Impact (Risk/Opportunity) | Financial impact (millions of yen) |
Countermeasures | ||
|---|---|---|---|---|---|---|
| 4℃ | 1.5℃ | Overview | ||||
| Transition risk |
Policies/ regulations |
Tightening of relevant regulations to control CO2 emissions | Higher business activity costs following introduction of carbon tax | 2 | 2 |
• Install LED lightning • Introduce renewable energy (purchase non-fossil certificates and green energy certificates) |
| Higher procurement cost of building materials following introduction of carbon tax | 1 | 1 |
• Use subsidiaries and incentive systems |
|||
| Reputation | Progress in investments and loans emphasizing climate change actions | Fall in investments as properties owned fail to adapt to climate change (higher interest rates as preferential interest rates are not applied) | - | 52 |
• Continue acquiring environmental certificates (issue sustainability bonds) • Enhance information disclosure and engage investors |
|
| Markets | Changing tenants' demands (Growing needs for properties adapting to climate change) |
Lower lease business income as properties owned fail to adapt to climate change | - | 199 |
• Continue acquiring environmental certificates • Anti-flood measures (install water stops, drainage pumps, water sensors, alarm devices) • Conduct disaster drills; secure disaster prevention goods • Reduce damage (lost rents) by purchasing fire insurance |
|
| Physical risk |
Acute | Escalation of natural disasters such as torrential rain, typhoon, flooding, landslide and high tide; higher risk of wind and water damage | Damage to properties owned and loss of business opportunities due to escalation of natural disasters | 1,022 | 511 | |
| Chronic | Rising average temperature and escalation of natural disasters | Higher energy cost due to the rising average temperature | 2 | 27 |
• Install LED lightning |
|
| Higher non-life insurance premiums due to escalation of natural disasters | 7 | 3 |
• Regular review of fire insurance policies |
|||
| Opportunities | Resource efficiency |
Strengthening of energy saving-related regulations | Smaller operating costs due to adoption of energy-saving measures | |||
| Products and services |
Changing tenants’ demands (Growing needs for the properties adapting to climate change) |
Higher rent income through provision of low CO2 emissions facilities and services to tenants (higher occupancy and higher rents) | ||||
| Markets | Progress in investments and loans emphasizing climate change actions | Fall in funding cost and increase in investments as actions are taken to address climate change (lower interest rates as preferential interest rates are applied) | ||||
- The figures stated as financial impact represent the annual monetary impact. An analysis was conducted on the risks and opportunities of climate change factors that are deemed to have a particularly material impact on ADL's business activities. Furthermore, the above estimates were calculated based on ADL’s past investment performance, scenarios presented by international organizations and others, and data released by relevant government agencies or other third parties. ADL therefore does not guarantee the accuracy of these figures. The countermeasures listed are also presented for the purpose of calculating the impact; no plan or decision has been made for their implementation.
Metrics and Targets, Results
| Energy consumption | 10% reduction (intensity) by FY2030 (compared to FY2020) |
|---|---|
| CO2 emissions (GHG) | Scope1,2:42% reduction (total) by FY2030 (compared to FY2020) →Net zero by FY2050 Emissions intensity of owned properties (Scope1,2,3 category13):10% reduction by FY2030 (compared to FY2020) |
Please click here to see our results
Environmental Targets
The following targets have been set for the entire property portfolio managed by IRM.
| Item | Short term target | Mid-to-long term target |
|---|---|---|
| Total energy consumption | - | By FY2030 (compared to FY2020) Reduce 10% (intensity) |
| Total CO₂ emissions(GHG) | - | 【Scope1,2】 42% reduction (total) by FY2030 (compared to FY2020) Net zero by FY2050 【Scope3】 Identification of corresponding categories and scope determination and calculation 【Emissions intensity of owned properties (Scope1,2,3 category13)】 10% reduction by FY2030 (compared to FY2020) |
| Total water consumption | - | By FY2030 (compared to FY2020) No increase (intensity) |
| Total waste generation | - | By FY2030 (compared to FY2020) No increase (intensity) |
Environmental performance data
Performance data for ADL portfolio properties for which data has been collected
| Item | Unit | Fiscal 2018 | Fiscal 2019 | Fiscal 2020 (Base year) |
Fiscal 2021 | Fiscal 2022 | Fiscal 2023 | Fiscal 2024 | Fiscal 2025 | Fiscal 2026 | Fiscal 2027 | Fiscal 2028 | Fiscal 2029 | Fiscal 2030 | Fiscal 2031 | Fiscal 2032 | Fiscal 2033 | Fiscal 2034 | Fiscal 2035 | Fiscal 2036 | Fiscal 2037 |
|---|---|---|---|---|---|---|---|---|---|---|---|---|---|---|---|---|---|---|---|---|---|
| Energy consumption | Total amount (MWh) | 8,317 | 19,919 | 23,087 | 22,568 | 24,981 | 24,883 | ||||||||||||||
| Energy intensity (/㎡) | 0.052 | 0.049 | 0.054 | 0.049 | 0.048 | 0.048 | |||||||||||||||
| Coverage rate (%) | 100% | 100% | 100% | 100% | 100% | 100% | |||||||||||||||
| CO₂ emissions(GHG) (Scope1,2,Scope3 category13) |
Total amount (t) | 3,961 | 9,619 | 10,307 | 9,836 | 8,837 | 8,668 | ||||||||||||||
| Emissions intensity (/㎡) | 0.0247 | 0.0240 | 0.024 | 0.021 | 0.017 | 0.017 | |||||||||||||||
| Coverage rate (%) | 100% | 100% | 100% | 100% | 100% | 100% | |||||||||||||||
| Scope1+2 | emission (t) | 194 | 205 | 0 | 0 | ||||||||||||||||
| Scope3 category1 | emission (t) | - | - | 740 | 824 | ||||||||||||||||
| Scope3 category2 | emission (t) | - | - | 158 | 327 | ||||||||||||||||
| Scope3 category3 | emission (t) | - | - | 0 | 0 | ||||||||||||||||
| Scope3 category5 | emission (t) | - | - | 3 | 2 | ||||||||||||||||
| Scope3 category13 | emission (t) | 10,113 | 9,631 | 8,837 | 8,668 | ||||||||||||||||
| Water consumption | Total consumption (㎥) | 10,520 | 27,150 | 30,219 | 26,589 | 27,729 | 28,774 | ||||||||||||||
| Consumption intensity (/㎡) | 0.0708 | 0.0714 | 0.074 | 0.060 | 0.055 | 0.057 |
CO₂ emissions (GHG Scope3)
Unit:【入力】文字列
| Category | |
|---|---|
| t-CO2 | |
| カテゴリー (英文) |
Fiscal 2023 |
| 1. Purchased goods and services | 824 |
| 2. Capital goods | 327 |
| 3. Fuel- and energy-related activities (not included in Scope 1 or Scope 2) | 0 |
| Total | 【入力】文字列 |
- 補足説明
(英文) - GHGScope3 calculations are made to determine CO2 emissions throughout the supply chain and to promote efforts toward net zero emissions. (From Fy 2022)
- Figures for properties held under quasi co-ownership are also included on a 100% basis.
- For properties acquired during the period, the total volume for the year is calculated regardless of the acquisition date, if data acquisition was possible.
- Starting in 2023, the data review period has been changed from April 1 to March 31 to January 1 to December 31; the data review period for fiscal years 2020 to 2022 is April 1 to March 31.
Only GHG Scope 3 data for FY2022 reflects the above change in the aggregation period. - The coverage rate was calculated as follows:
Square meters of floor area for which data was collected ÷ square meters of total portfolio floor area - Total CO₂ emissions were calculated using the emission coefficients indicated in the "Standards for Greenhouse Gas Emissions Calculation, Reporting, and Disclosure," of Japan’s Ministry of Environment .
Reduce Energy Consumption and Conserve Resources
In cooperation with its tenants, IRM shall consider installing more energy-efficient equipment and make use of renewable energy sources at its properties in order to proactively reduce electricity consumption, conserve water, and facilitate recycling.
Utilization of renewable energy and GHG reduction
- i Missions Park Ichikawa-Shiohama, In addition to the power generated from solar panels provided by VPP Japan, purchased electricity with a non-fossil value from ITOCHU Corporation. achieving the 100 percent sourcing of energy used in IMP Ichikawa from renewable energy sources.
- By purchasing FIT non-fossil certificates equivalent to the amount of electricity used in the common areas of the properties, together with the initiatives at i Missions Park Ichikawa-Shiohama mentioned above, 100% of the energy used in the common areas of ADL-owned properties was converted to renewable energy and 100% of the GHGScope2 was offset.
- We lease spaces on the rooftops of some of our properties to tenants for the installation of solar panels to help them generate renewable energy.
Example of solar panel installation
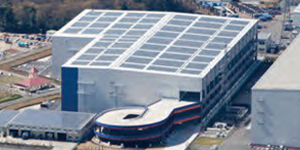
i Missions Park Noda
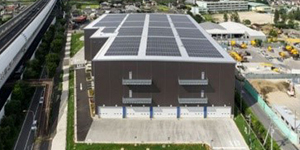
i Missions Park Misato
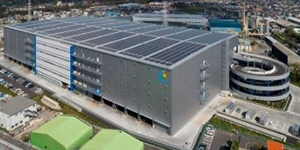
i Missions Park Kashiwa 2
LED lighting
ADL is promoting the use of LED lighting in our owned properties to reduce energy consumption.
Example of LED Lighting
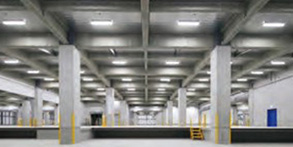
i Missions Park Misato
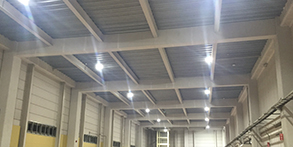
i Missions Park Moriya2
Demand Controls
Demand control, a system that automatically adjusts the operation of properties according to electricity demand, has been installed in some ADL-owned properties. The introduction of this system has led to a reduction in electricity consumption.
Demand control (centralized control unit)
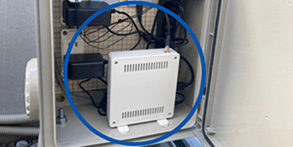
i Missions Park Noda
Water-saving
Water-saving products are being placed in toilets and sinks in owned properties to conserve water resources.
(Example of water-saving equipment)
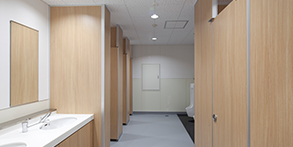
i Missions Park Noda
Greening
Greening is being promoted in the car parks of some owned properties as part of efforts related to climate change adaptation.
Example of green parking lot
i Missions Park Misato
GHG Reduction with tenants
Some of ADL‘s properties have been approved for the Comprehensive Efficiency Plan under the Act on Advancement of Integration and Streamlining of Distribution Business, and ADL is promoting CO2 reduction in collaboration with tenants.
Setting Green-lease Contract Clauses
Promoting the introduction of clauses related to the reduction of environmental impact such as energy saving of real estate (green lease clauses) in management consignment contracts with property management companies and in lease contracts with tenants.
Supply Chain Management
IRM has established a Sustainability Procurement Policy to put the sustainability policy’s specific component into practice with the cooperation from its suppliers.
To strengthen the engagement with suppliers, major suppliers including all property management companies that IRM uses as a vendor have been evaluated by conducting surveys at the start of the contract and annually in accordance to the policy, on how they are addressing sustainability issues.
For more information on the initiative, please click here (IRM website).
Utilize Environmental Certification Programs
IRM shall actively strive to acquire environment-related certifications from third-party organizations as a means to add more value to its properties, meet environmental standards expected by stakeholders, and incorporate such standards in its asset management policy.
Percentage of environmental certifications %
| Property name | ||||||
|---|---|---|---|---|---|---|
| 表示 | 非表示 | 表示 | 表示 | 表示 | 非表示 | |
| 物件名称 (英文) |
DBJ Green Building Certification |
CASBEE (New Construction) |
CASBEE (Real Estate) |
BELS certification | ZEB certification | other |
| i Missions Park Kashiwa | ★★★ | |||||
| i Missions Park Noda | ★★★ | |||||
| i Missions Park Moriya | ★★★★ | ★★★★★ | ||||
| i Missions Park Misato | ★★★★ | ★★★★ | ||||
| i Missions Park Chiba-Kita | ★★★★★ | |||||
| i Missions Park Inzai | ★★★★ | ★★★★★ | ||||
| i Missions Park Kashiwa2 | Rank S | ★★★★★ | ZEB Ready |
- テキスト(英文)
- As of July 26, 2024
Please click here,for more information on BELS certification for individual properties.